● Restaurants & coffee shops · Toronto
Know your numbers before service.
Dashboards, written reviews and clean data for independent restaurants and coffee shops — built from the POS, payroll and invoices you already have.
Founding offer Setup waived for our first 10 cafés and restaurants →Built by a data analyst who runs his own food businesses. No new software to learn. Toronto has thousands of independent restaurants and cafés — this is built for them.
01 Why it matters
Big-chain analytics,
independent price.
Chains — from burger groups to the big coffee brands — have finance teams watching every point of margin. Independents have a POS full of reports nobody has time to read.
55–60%
Healthy prime cost (food + labour) for most full-service restaurants. Every point above it comes straight off profit.1
$150–350/hr
What restaurant consultants typically charge to diagnose prime cost — often $10k+ per engagement.1
US$350/mo
Per location for leading restaurant back-office software — and you still have to do the work yourself.2
03 Live demo
This is what Monday looks like.
Your portal with 13 weeks of sample data. Pick a coffee shop, a pizzeria or a brunch & bar — each one tracks the numbers that matter for that kind of place. Hover any chart for the numbers.
Net sales
$48,212
▲ 3.7% on track
Prime cost
60.4%
▼ 2.6 pts vs 4 wks on track
Avg ticket
$7.70
▼ 0.4% watch
Items / transaction
1.44
▲ 0.0% on track
Prime cost by location, weekly
Cost of goods (4-week rolling) + labour, as % of net salesAnnex runs 64.2% prime cost: weekend afternoons keep a full barista crew for half the traffic, and dairy went up ~9% in July. Labour is 38.4% of sales — that's the first fix.
Menu engineering
Units sold × margin per itemWhen customers come in
Transactions · average by weekdayNet sales
$58,625
▼ 1.0% watch
Prime cost
57.8%
▼ 1.2 pts vs 4 wks on track
Avg order
$35.38
▲ 0.5% on track
Delivery apps
40.4%
▲ 2.1 pts · ~30% commission watch
Prime cost by location, weekly
Food cost (4-week rolling) + labour, as % of net salesLeslieville runs 61% prime cost and 53.7% of its sales come through delivery apps — the ~30% commission comes on top. The kitchen is fully staffed on slow Monday–Wednesday nights, and cheese is up ~12% since August.
Menu engineering
Units sold × margin per itemWhen orders come in
Orders · average by weekdayNet sales
$46,522
▲ 2.8% on track
Prime cost
55.7%
▼ 0.5 pts vs 4 wks on track
Avg cheque
$36.29
▲ 0.7% on track
Bar cost (pour)
26.0%
▼ 1.3 pts · target 24% watch
Prime cost, weekly
Food + bar cost (4-week rolling) + labour, as % of net salesWeekend brunch is 48.2% of sales. Prime cost looks fine at 55.7%, but bar cost has crept to 26% of bar sales (target 24%) since June — heavy pours and comped cocktails. Monday–Tuesday dinners are over-staffed.
Menu engineering
Units sold × margin per plate / drinkWhen guests arrive
Covers · average by weekday04 How it works
You run the room.
We do the numbers.
No new software for your team, nothing to learn, nothing to upload. One visit to start, then your numbers simply show up.
- 01
One visit
We come in once, for about an hour. You give us read-only access to your POS reports and we set your targets together.
- 02
We pull the numbers
Every week we collect and check your sales ourselves. You don’t export, upload or type anything.
- 03
Monday, 7 am
Last week arrives on your phone: what went well, what didn’t, and anything worth a look today.
- 04
Every two weeks
From Pro, a short written review: what changed, why, and the 2–3 things to do next. Plus a call once a month.
05 Reports
A report you'll actually read.
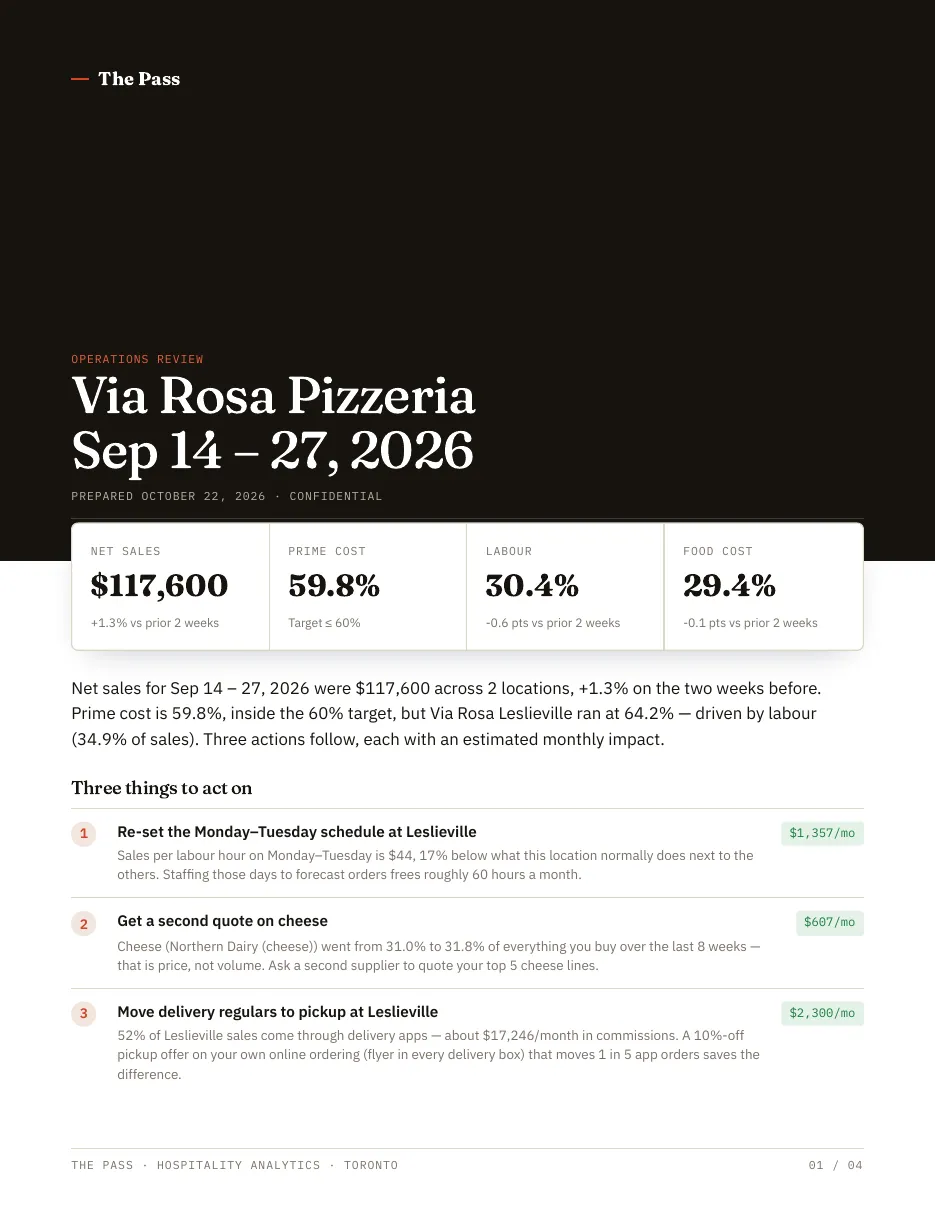
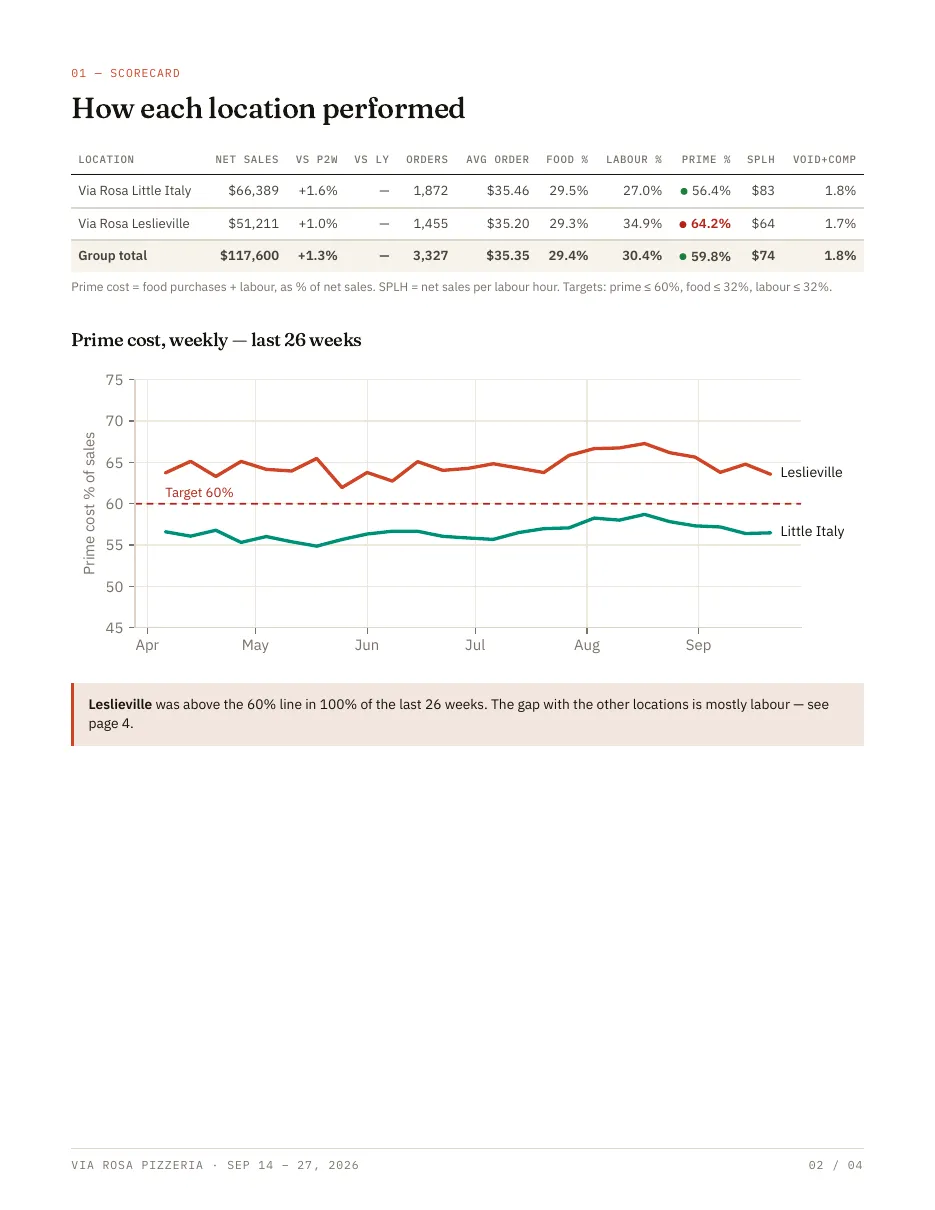
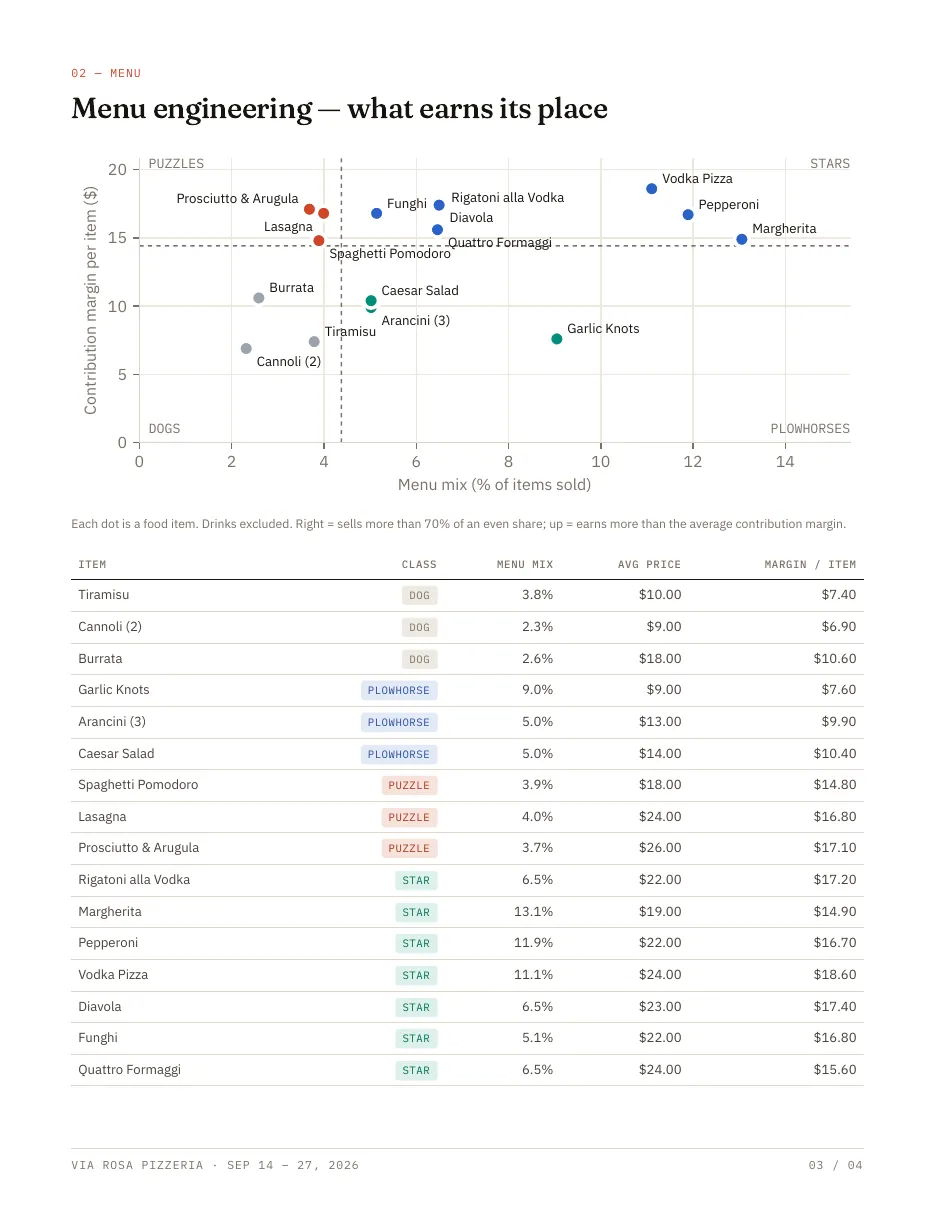
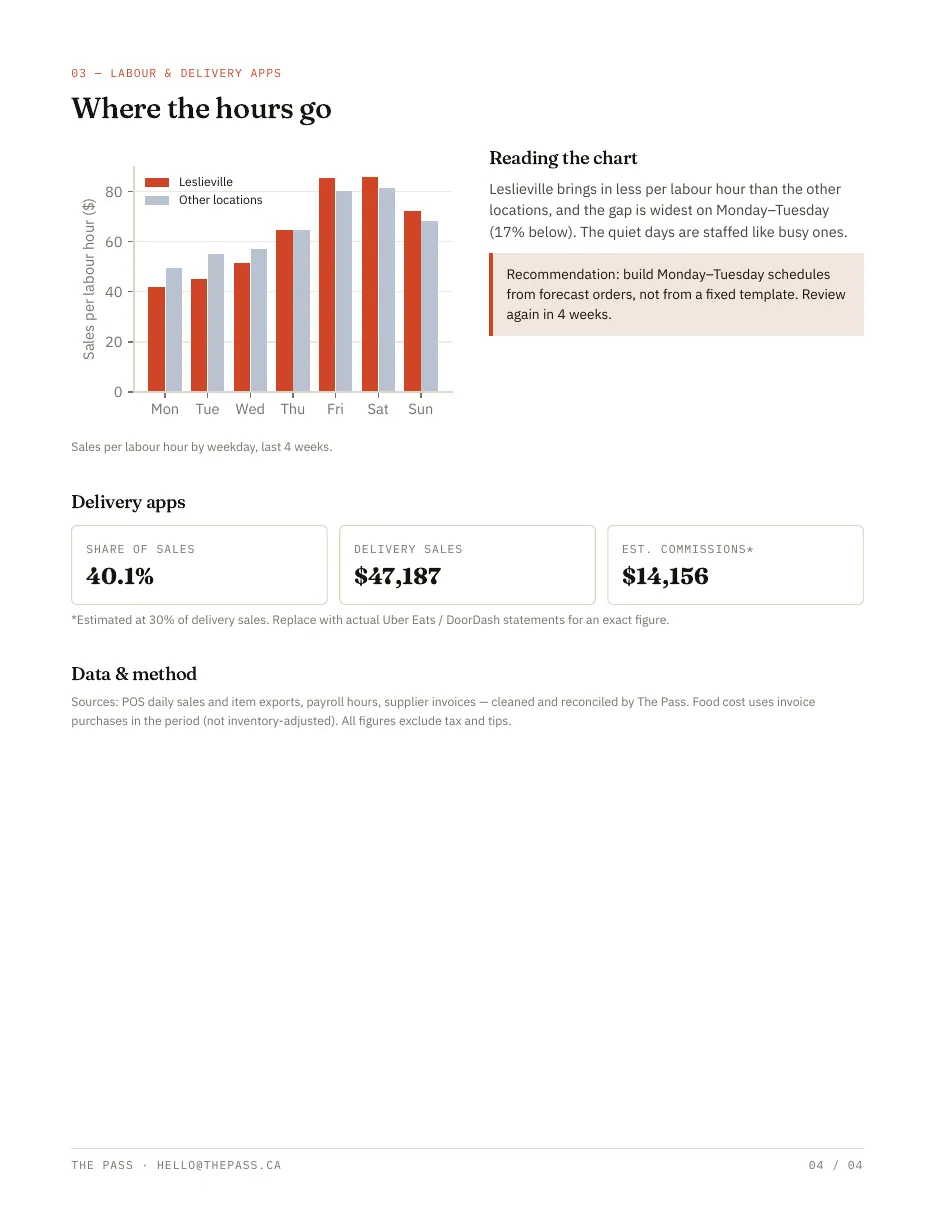
Every second Monday, a short designed PDF lands in your portal: what changed, why it happened, and two or three specific things to change. Written for owners and GMs, not accountants.
- Sales, covers, average cheque and prime cost vs target
- Supplier price movers and menu items to reprice
- Labour vs demand by day and shift
- Plain-English actions — two or three, not thirty
Sample review for each type: Coffee shop · Pizzeria · Brunch & bar
06 Who's behind it
“Running my own food businesses, I see it every week: the numbers that matter — food cost, labour, what actually sells — are already in the POS and the invoices. They just never make it to the pass.”
Julio Carneiro · Founder · Toronto · About →
07 Questions
Before you
say yes, chef.
Do I need to change my POS?+
No. We work with the POS you already have — Square, Lightspeed, Toast, TouchBistro, Clover and more.
How much of my time does it take?+
One hour at the start. After that, none — we pull the numbers ourselves. You just read the Monday email and, from Pro, a short review every two weeks.
Is my data safe?+
It is stored in Canada, encrypted, and only your logins can see it. We sign an NDA before we touch anything, and you can ask for it deleted at any time.
I run a coffee shop, not a restaurant. Does it fit?+
Yes. Same three numbers drive a café — cost of goods (beans, milk, pastry), labour and traffic — just at a smaller ticket. We track average ticket, items per transaction, dairy and bean prices, and baristas per hour against your morning and weekend peaks. Square, Lightspeed and Clover all work.
I only have one location. Is this for me?+
Yes — single independents are who we built this for. Groups get a roll-up across locations.
Can I see my numbers on my phone?+
Yes. Add the portal to your home screen and it opens like an app — your numbers, reports and Monday email, all in one place.
1. Nation's Restaurant News, “Why restaurants don't need an $11,000 consultant to fix prime cost anymore” (opinion piece; composite figures).
2. MarginEdge pricing page, Oct 2026 — US$350 per location per month, billed monthly.